
Where will there be grid capacity when your solar park is ready?
Rasmus Pedersen, Northing · 29 September 2026
I checked 31 European countries. Nine publish a number, substation by substation, for how much new generation the grid can take in future years or after planned upgrades. Three publish that number for today, on both the national and the local grids. September 2026.
Even with no grid queue at all, a ground-mounted solar park takes time. EU law gives permit authorities up to two years outside designated fast-track areas and one year inside them, and the industry reports two to four years in practice. Building takes six months to a year. By the time you can connect, today's available capacity may be taken. So the useful question is not only where the grid has capacity now. It is where it will have capacity when you are ready.
That is the question a developer has on a Tuesday afternoon. Not "is there grid data?" There usually is. The question is: for this substation, is there a published number for how much generation can connect, now or later, and how much should I trust it?
What I looked for
I looked for one thing: a published figure for available capacity, meaning how much new generation can still connect to the grid at a given place. It is a screening figure. How operators treat projects already in the queue, and the conditions they attach, differ by country, and no figure is a promise of a connection. Three questions decide whether such a figure helps you, and every count in this piece says which answer it covers.
- Which grid. Every country has a national grid and local grids. The national grid is the high-voltage network (transmission). The local grids are the lower-voltage networks (distribution). "National" and "local" describe the voltage level, not how much of the country a figure covers. A country often has several local grid operators, and each one publishes, or does not, on its own.
- When. Available capacity on today's grid, or later: in a named future year, or after upgrades the operator has planned.
- How precise. A number for a specific substation lets you screen sites. By "a number" I mean a capacity value in megawatts (MW), the similar MVA or, for Malta, kWp. A range or a colour, one total for a whole zone, or figures from only some of the operators are rougher signals. Some operators publish per grid node, which is usually one voltage level at a substation; I count that as per substation.
I counted available capacity for generation only: power fed into the grid. A battery also draws power from the grid, and figures for that are not counted here. Two figures bend this definition and are labelled where they appear: in the Netherlands I calculate the figure myself, and Bulgaria's covers generation and consumption together.
A country can appear in several counts, so the counts do not add up to 31.
What I found
Available capacity later. 16 countries publish something about available capacity after today, on at least one of the two grids. In 9 of them it is a number per substation (Denmark, Finland, France, Hungary, Ireland, Luxembourg, Poland, Spain, Switzerland). In the other 7 it is rougher: a range, a total per zone, planned megawatts written as text, or the year a connection becomes possible.
Available capacity today, both grids. In 3 countries (Denmark, France, Spain), the national grid and the local grids both publish a number per substation, across the whole country. You can screen a site at both levels straight from the source. All three are also among the nine for later.
Available capacity today, one grid at a time. For today's local grids, 18 countries publish a number. For today's national grid, 15 do. Some of those numbers are per zone or cover only some operators; the tables at the end say which.
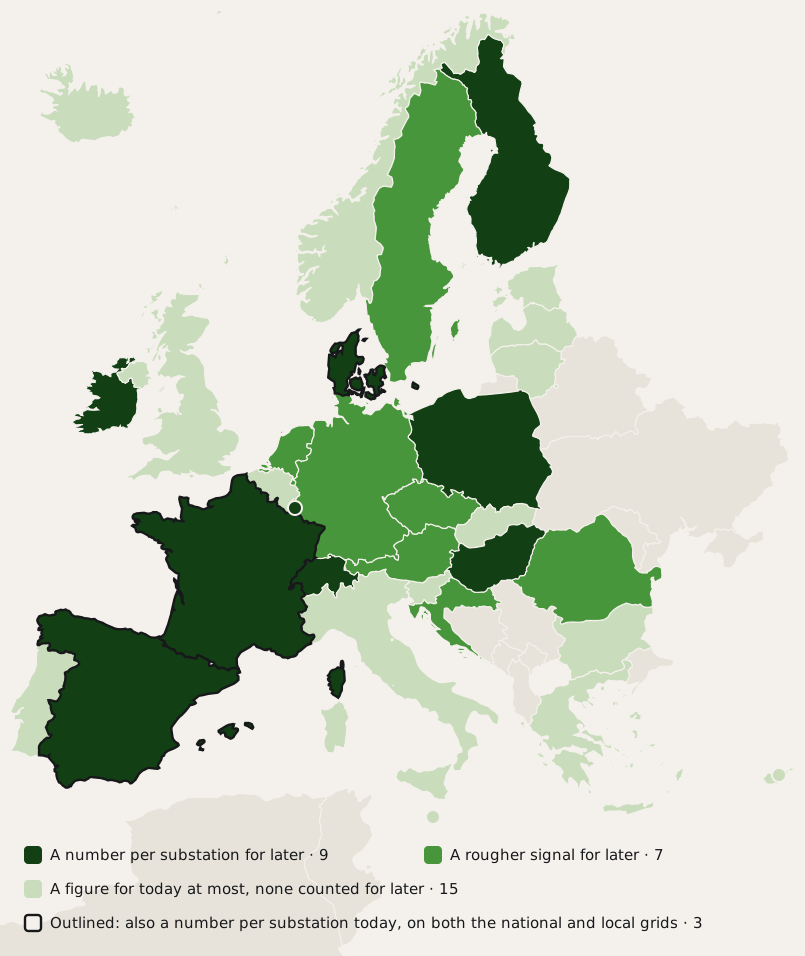
The index I published in August graded whether grid-capacity data is open and readable by a program. A good grade there tells you a usable source exists. It does not tell you what number is in it. An operator can publish queued megawatts, contracted megawatts or a colour, and all of them look like capacity data. This piece looks at the number.
Available capacity later: 9 countries publish a number per substation
What operators publish about the future comes in different forms, and not every form comes with a year or a number:
- a figure for the grid after planned upgrades, sometimes with no year attached,
- a figure for each future year,
- capacity held back for future tenders,
- the year a connection becomes possible.
16 countries publish at least one of these. In 9 it is a number per substation. The table "Available capacity later, in detail" at the end lists all 16. Some examples:
- Denmark publishes a second figure for the grid after approved upgrades. Aalborg Øst: 230 MW today, 478 MW after upgrades. No year is attached.
- Switzerland's national operator gives a figure per substation for 2026, 2030, 2035 and 2040, on the grid as planned for each year. Many go from 0 today to 300 later. The unit is not printed; I read it as MVA.
- In Finland, about a third of 181 national stations get more capacity as planned upgrades are completed, mostly in 2027, 2028 and 2030.
- Luxembourg's national figure goes from 501 MW today to 1,521 MW in 2030, and on the local grids new substations appear in the 2030 and 2035 data.
- Ireland publishes a figure per substation for every year to 2040, then 2045 and 2050, under two sets of assumptions about the future.
- One Austrian operator writes planned upgrades next to today's figure. Prottes: 0 MVA today, 160 MW more planned by the end of 2030.
- The Netherlands shows both directions. In most national zones the available capacity grows. In one, Flevopolder, Utrecht and Gelderland, the capacity already promised to customers grows faster than the grid: 714 MW short in 2026, 1,678 MW short in 2033.
- Poland's national operator publishes 2031 beside 2026. Its "realistic" figure is 0 MW at every node in both years.
- Norway has required operators since January 2025 to publish available capacity "in today's grid and the future grid" at every transmission and regional station. I did not find the national operator's figures.
A planned figure is the operator's own expectation, not a promise, and several operators say it gives you no right to connect. It is still the best early signal a developer can get. Some of the nine are capacity reserved under renewables plans (France) or held for tenders (Spain, and a wind tender in Hungary), which a new solar project cannot necessarily use. Italy's largest local operator shows only the next quarter; that is too short for a project that takes years, so I did not count it.
Available capacity today: 3 countries publish a number per substation on both grids
In Denmark, France and Spain, the national grid and the local grids both publish a megawatt figure per substation, across the country: from the operators themselves, or in Spain from the regulator's national register of their figures. You can screen substations at both levels straight from the source.
Counting both grids together, the 31 countries fall into five groups for today:
- A number per substation on both grids, across the country: 3 (Denmark, France, Spain). Denmark's local figure covers 9 of 11 operators, about 98% of electricity meters. France's local figures come through one national channel, with the largest operator verified by name.
- A number on both grids, but rougher on one of them: 7 (Finland, Lithuania, Luxembourg, Netherlands, Poland, Slovakia, United Kingdom). Per zone instead of per substation in Lithuania, the Netherlands and Poland. One figure for a whole grid or area in Luxembourg and Slovakia. Per line section or area, and only a few operators, in Finland. Northern Ireland only in the United Kingdom.
- A number on one grid only: 13 (Austria, Bulgaria, Cyprus, Czechia, Greece, Ireland, Latvia, Malta, Portugal, Romania, Slovenia, Sweden, Switzerland).
- Only ranges or colours: 3 (Croatia, Estonia, Italy).
- No confirmed figure for today: 5 (Belgium, Germany, Hungary, Iceland, Norway). That is not the same as nothing. Some searches were not finished, some figures were for consumption, the only German figure with megawatt ranges looks ahead to 2032 and later, and Hungary's local figures are for a wind tender looking ahead to 2030.
Looking at each grid on its own, for today:
- National grid: a number in 15 countries, only a range or colour in 2, none found in 2 (Ireland and Portugal, where my search was complete), and not confirmed in 12. Czechia and Germany are among the twelve because their national figures only look ahead.
- Local grids: a number in 18 countries, only a range or colour in 5, nothing found in 1 (Germany, among the operators whose pages I could read), and not confirmed in 7. Hungary is among the seven because its local figures only look ahead.
"Not confirmed" means my search was not finished, or I could not confirm what a figure means. It does not mean there is no figure. Where I found a figure, it exists; where I did not, there may still be one.
What else I found
Local grids publish more than the national grid does. For today's grid, 18 countries publish a number for their local grids, and 15 for their national grid. The national grid is where I most often could not confirm anything: 12 countries. In Greece, Italy, Latvia and Norway, what the national operator publishes is a queue, a reservation list or an offer bulletin. Those list projects that have already claimed capacity, not the capacity still available. Several of the twelve are unfinished searches, not confirmed absences.
A number from every local operator is rarer than a number. Of the 18 countries with a local-grid number today, 9 have one from every operator I expected to find, leaving out the smallest (Austria, Ireland, Latvia, Lithuania, Malta, Netherlands, Portugal, Slovakia, Spain). Denmark and France come close. In the other seven, I found figures from only some operators: the capital region in Czechia, one of five in Poland, one of four in Luxembourg, three of fifteen in the United Kingdom. For most of the remaining operators I did not check whether they publish, so the real number may be higher.
In the Netherlands you can see the congestion with one subtraction. The Dutch operators do not publish available capacity. They publish, per zone, the grid's maximum and the capacity already promised to customers under contracts, in the same file. Subtract one from the other. In 7 of the 12 national zones with a 2026 figure, more is already promised than the grid can carry. Flevopolder, Utrecht and Gelderland: 2,613 MW of grid against 3,327 MW promised. On the local grids, 30 of 346 areas come out negative. No other country publishes both halves side by side.
Hungary publishes something nobody else does. A national register, updated quarterly by law, of connection rights already granted, built or not: who holds each one, how many MVA it can feed into the grid, whether it is in operation. The law behind it says why: so investors can find existing connection points built by others. It is not available capacity on the grid, so it does not count here. But if you want to put a battery next to an existing solar park, this is where you would start.
In Germany I found no figure for today. On the local grids, I reached 17 of about 68 operators, together holding 92% of the 110 kV network (the highest-voltage part of the German local grids). I could read the pages of eight of them, about 37% of that network, and none publishes a figure. Six blocked automated access or could not be reached, and three more I could not get a figure out of. One sells capacity answers per request. On the national grid, one of four operators publishes megawatt ranges, all for 2032 or later; a second publishes a map coloured by whether a connection is feasible, with no year I could pin down.
Free to download is not free to reuse. In 26 countries I got the figures with no account, key or login. Only 2 say outright that you may reuse them commercially (Denmark, Portugal), and 2 say you may not (Ireland, Latvia). For the rest I found no licence either way. In 13 countries, I got the figures by reading the data the operator's map loads behind the scenes, which the operator does not document and can change without notice.
A promised update schedule is not always kept. Of the 26 countries with a figure for today, 15 state how often they update it, on at least one of the two grids; in Croatia the schedule is set by law. Slovenia says only "updated regularly". For four more I could only see the dates of past editions (Finland, France, Ireland, Latvia). Six show neither. Croatia's law says every year; the national edition I found is from February 2024. Sweden's monthly schedule has one edition behind it so far. For Denmark, see below.
Some figures cover one technology only: renewables in Cyprus, Greece and Malta, solar at Sweden's one local operator. Lithuania publishes separate solar, wind and storage figures. France frames its figures around its regional renewables connection plans.
Denmark, since I am Danish
Denmark is one of the three. Both grids publish a number per substation, through a documented data service, under a licence that allows commercial reuse. It is the only country where I confirmed that permission on both grids.
It is also the country that shows what a precise number does not tell you. The national figures are dated 1 February 2026, although the operator says it updates them monthly. The earlier edition I hold, from the dataset this one replaced, is dated June 2024. The local-grid download is dated 1 January 2026, although the stated schedule is quarterly. The operator's own map carries local figures dated 1 September 2026. So the number a program reads and the number a person sees on the map are not the same edition.
The operator describes the national figure as usually an average over a typical weather year. It does not say whether the figure holds when part of the grid is out of service. Almost every station also carries a figure for the grid after approved upgrades (Aalborg Øst: 230 MW today, 478 MW after upgrades), but no year for when. The highest-voltage level, 400 kV, is not included. I print the dates, not a verdict.
What this piece does not say
It does not say which country has the most capacity, or where to build. It does not say that a country without a figure has no capacity. On the national grid, 10 countries are unfinished searches or figures whose meaning I could not confirm (the other two of the twelve, Czechia and Germany, only publish figures for later). On the local grids, 6 are (the seventh, Hungary, only publishes figures for later). A published figure helps you shortlist sites; it does not give you a connection, and several operators say so on the page. And being able to download a figure is not permission to build a product on it.
Put it to work
If you screen sites in Denmark, France or Spain, the published figure is a first filter you can refresh from the source. Everywhere else, the country's row in the tables below tells you what to ask the operator for.
Northing, the site-screening tool I build, shows Denmark's figures per site today, with their dates. Developing in another European country? I set up new markets on request. Send me a market, a technology and one to three sites (no names needed), and I will tell you which of these figures applies and what still needs a call.
Open the consoleRequest access
If you run one of these networks and your row is wrong or short, tell me: the country, the grid level, the public source, and how a program reaches it. I will check the live source. Corrections I can verify go into the next revision, with credit.
The tables
Three tables: an overview with one row per country, then today in detail, then later in detail.
How to read them:
- number: a capacity value in MW, MVA or, for Malta, kWp (peak kilowatts). range or colour: a category instead of a value, for example green, amber and red, or a span of megawatts.
- not confirmed: my search was not finished, or I could not confirm what the figure means. Not a verdict. none found: I finished the search and found no figure.
- my calculation (Netherlands) and generation and consumption combined (Bulgaria): useful figures that are not the operator's own figure for new generation. See "How I counted".
- one operator or some operators: I confirmed figures from only one, or only some, of the operators I expected. not counted: something is published, but I left it out, for the reason given in the text. all expected operators: every operator I expected for that grid, leaving out the smallest local ones. It does not guarantee that the whole country is covered.
- service: a data service a program can query. spreadsheet: a downloadable file. undocumented interface: I read the figures from the data a map loads behind the scenes, which the operator does not document.
- dated: the date printed on the data. stated: an update schedule the publisher declares.
- net of queue: the operator has already subtracted projects waiting to connect. firm basis stated: the operator says the figure holds under strict conditions, for example with part of the grid out of service. method statement: the operator explains how it calculates the figure.
- Login needed? whether you need an account, key or login to get the figures. Commercial reuse: what the licence where the figures are served says. Public access is not permission.
An asterisk marks a country where at least one level is verified only in part (some regions or some operators), and the cell says how far it reaches.
Overview
| Country | Today, national grid | Today, local grids | Later |
|---|---|---|---|
| Austria | not confirmed | number per substation | planned MW written as text (one operator) |
| Belgium | not confirmed | not confirmed | not confirmed |
| Bulgaria | number per substation (generation and consumption combined) | not confirmed | not confirmed |
| Croatia | range or colour per substation | range or colour per substation | range after a hypothetical upgrade |
| Cyprus | number per substation | not confirmed | not confirmed |
| Czechia | later only | number per substation (one operator) | suitable or not, 2031 and 2036 |
| Denmark | number per substation | number per substation | number per substation, after upgrades, no year |
| Estonia | not confirmed | range or colour per line segment (one operator) | not confirmed |
| Finland | number per substation (one operator) | number per line section or area (some operators) | number per substation, to 2035 |
| France | number per substation | number per substation | number per substation, reserved MW, no dates |
| Germany | later only | none found | range with earliest year, 2032 or 2035 |
| Greece | not confirmed | number per zone (non-interconnected islands only) | not confirmed |
| Hungary | not confirmed | later only | number per substation, wind tender, 2030 |
| Iceland | consumption only | not confirmed | not confirmed |
| Ireland | none found | number per substation | number per substation, to 2050 |
| Italy | not confirmed | range or colour per zone (one operator) | next quarter only (not counted) |
| Latvia | not confirmed | number per substation | not confirmed |
| Lithuania | number per zone | number per substation | not confirmed |
| Luxembourg | number, one value for the whole grid | number per substation (one operator) | number per substation, 2030 and 2035 |
| Malta | not confirmed | number per substation | not confirmed |
| Netherlands | number per zone (my calculation; 12 of 27 zones) | number per zone (my calculation) | zone totals to 2036; year congestion clears |
| Norway | not confirmed | consumption only | described on an operator's page, map not seen (not counted) |
| Poland | number per substation | number per group of substations (one operator) | number per substation, 2031 |
| Portugal | none found | number per substation | not confirmed |
| Romania | number per zone | range or colour per substation (one operator) | zone total, 2030 |
| Slovakia | number, one total (western Slovakia only) | number per substation | not confirmed |
| Slovenia | number per substation | range or colour per substation | not confirmed |
| Spain | number per substation | number per substation | number per substation, held for tenders, no dates |
| Sweden | range or colour per zone | number per substation (one operator) | years until you can connect (one operator) |
| Switzerland | number per substation | not confirmed | number per substation, 2030 to 2040 |
| United Kingdom | number per substation (Northern Ireland only) | number per substation (some operators) | not confirmed |
Available capacity today, in detail
| Country | National grid (transmission) | Local grids (distribution) | Login needed? | Commercial reuse |
|---|---|---|---|---|
| Austria | not confirmed (no national grid operator figure found; search not complete) | number (MW/MVA) per substation, service · dated 2026-07-30 · stated quarterly · all expected operators · undocumented interface · firm basis stated | no | not confirmed |
| Belgium | not confirmed (national grid operator site blocked access from three networks) | not confirmed (one local operator's interface returns what looks like numbers, but the values could not be confirmed) | n/a | n/a |
| Bulgaria | generation and consumption combined: available capacity for any new connection; the operator's generation-only rows were not served in any archived response · number (MW/MVA) per substation, service · stated at least monthly · all expected operators · method statement · net of queue | not confirmed (per-settlement "available / not available" checkers, never queried; 0 of 3 operators confirmed) | no | not confirmed |
| Croatia | range or colour per substation, PDF · dated 2024-02-29 · annual by law, not met · all expected operators | range or colour per substation, PDF · dated 2026-06-09 · annual by law · all expected operators | no | not confirmed |
| Cyprus | number (MW/MVA) per substation, service · refresh not confirmed · all expected operators · undocumented interface · firm basis stated · net of queue | not confirmed (the sole distributor's site could not be reached from two networks) | no | not confirmed |
| Czechia | no figure for today; the operator's assessment looks 5 and 10 years ahead (see planned capacity) | number (MW/MVA) per substation, service · dated 2026-08-24 · stated monthly · 1 of 3 expected operators (the capital region) | no | not confirmed |
| Denmark | number (MW/MVA) per substation, service · dated 2026-02-01 · stated monthly; editions I hold are dated 2026-02 and, from the dataset it replaced, 2024-06 · all expected operators · existing-grid figure counted (140 of 160 stations); a reinforced-grid figure is served beside it | number (MW/MVA) per substation, service · dated 2026-01-01 · stated quarterly; export dated 2026-01, earlier edition 2024-07 from the dataset it replaced; the map backend shows 2026-09-01 · 9 of 11 expected operators (about 98% of meters) | no | expressly permitted |
| Estonia | not confirmed (no qualifying transmission figure verified; search incomplete) | range or colour per line segment, service · dated 2026-09-01 · refresh not confirmed · 1 of 3 expected operators (the dominant one) · undocumented interface | no | not confirmed |
| Finland | number (MW/MVA) per substation, service · refresh not confirmed · 1 of 2 expected operators · undocumented interface | number (MW/MVA) per line section or area, service · dated 2026-09-14 (one operator) · two editions 8 days apart, no interval stated · 3 of 10 expected operators · undocumented interface | no | not confirmed |
| France* | number (MW/MVA) per substation, service · rolling per-substation update dates, no interval stated · all expected operators · undocumented interface | number (MW/MVA) per substation, service · rolling per-substation update dates, no interval stated · national channel; 1 of 2 expected operator groups verified by name · undocumented interface · method statement · net of queue | no | not confirmed |
| Germany* | no figure for today established: one operator's bands (37 of 52 stations "not available", 15 banded) all look ahead to 2032 or 2035 (see planned capacity); a second publishes a feasible-or-not colour map, not dated to a year | none found (17 of about 68 operators reached, 92% of 110 kV circuit length; the eight I could read, about 37%, publish no figure; six were walled or unreachable) | n/a | n/a |
| Greece | not confirmed (offer bulletin carries contracted and installed MW, not available capacity) | number (MW/MVA) per zone or region, PDF · dated 2023-07-21 · refresh not confirmed · one operator, non-interconnected islands only | no | not confirmed |
| Hungary | not confirmed (the national register lists connection rights companies already hold, not available capacity; the tender list gives bay counts, not MW, at 132 kV and above) | no figure for today; the published figures are for a wind-capacity tender with a 2030 Q3 horizon, 5 of 6 expected operators (see available capacity later) | n/a | n/a |
| Iceland | not confirmed for generation (a regional narrative gives megawatts of added load at delivery points) | not confirmed (largest operator not examined) | n/a | n/a |
| Ireland | none found (search complete) | number (MW/MVA) per substation, spreadsheet · dated 2025-12-12 · four releases seen 2020 to 2025, no interval stated · all expected operators · firm basis stated | no | expressly restricted |
| Italy | not confirmed (the national operator's portal is open only to institutions and registered developers; a public connection-request register exists, which is a queue) | range or colour per zone or region, service · dated 2026-09-01 · stated monthly · 1 of 13 expected operators (the dominant one, national map by province) · undocumented interface | no | not confirmed |
| Latvia | not confirmed (a connection-queue table exists, not available capacity) | number (MW/MVA) per substation, service · dated 2026-09-14 · two releases a week apart (2026-09-07, 2026-09-14), no interval stated · all expected operators · undocumented interface | no | expressly restricted |
| Lithuania | number (MW/MVA) per zone or region, service · dated 2026-09-07 · refresh not confirmed · all expected operators · the same figure for every year 2026 to 2035 | number (MW/MVA) per substation, service · dated 2026-09-07 · refresh not confirmed · all expected operators · method statement | no | not confirmed |
| Luxembourg | number (MW/MVA) as one value for the whole 220 kV system, service · dated 06/07/2026 (day and month order unresolved) · stated quarterly · all expected operators · undocumented interface · firm basis stated | number (MW/MVA) per substation, service · dated 06/07/2026 (day and month order unresolved) · stated quarterly · 1 of 4 expected operators · undocumented interface · firm basis stated | no | not confirmed |
| Malta | not confirmed (132, 33 and 11 kV tiers uncovered by the feed found) | number (kWp) per substation, service · stated quarterly · all expected operators · renewables only; low-voltage tier only, 33 and 11 kV not confirmed | no | not confirmed |
| Netherlands | my calculation: the grid's maximum minus the capacity already promised, both published in one file; 7 of 12 zones come out negative · number (MW/MVA) per zone or region, spreadsheet · dated 2026-04-23 · stated at least quarterly (queue monthly) · the sole national grid operator; a 2026 feed-in value for 12 of 27 zones · method statement | my calculation: the grid's maximum minus the capacity already promised, both published in one file; 30 of 346 areas come out negative · number (MW/MVA) per zone or region, spreadsheet · dated 2026-06-25 to 2026-08-28 by operator · stated at least quarterly (queue monthly) · all expected operators (one large operator's values cover 18 of its 244 areas) · method statement | no | not confirmed |
| Norway* | not confirmed (the national operator's queue product carries reserved and queued MW per case, not available capacity) | not confirmed for generation (one regional operator publishes a per-substation N-1 figure for consumption; a second says its banded map covers production, not checked) | n/a | n/a |
| Poland | number (MW/MVA) per substation, PDF · dated 2026-08-31 · stated monthly · all expected operators · method statement · net of queue · the operator's headline step reads 0 MW at every node for 2026 | number (MW/MVA) per group of substations (46 groups), PDF · dated 2026-08-31 · stated quarterly · 1 of 5 expected operators · net of queue | no | not confirmed |
| Portugal | none found (search complete) | number (MW/MVA) per substation, service · dated Q2 2026 · stated quarterly · all expected operators · method statement · net of queue | no | expressly permitted |
| Romania | number (MW/MVA) per zone or region, service · dated 2026-08-13 · stated twice a year · all expected operators · undocumented interface · zone figure blends transmission and distribution inputs; whether planned reinforcement is included not confirmed | range or colour per substation, PDF · refresh not confirmed · 1 of 5 expected operators · method statement | no | not confirmed |
| Slovakia | number (MW/MVA) operator total, HTML table · stated weekly · one distribution area of three (western Slovakia) · net of queue | number (MW/MVA) per substation, service · dated 2026-07-01 (two operators) and 2026-09-08 (third) · no interval stated · all expected operators · undocumented interface · method statement | no | not confirmed |
| Slovenia | number (MW/MVA) per substation, service · dated 2026-07-08 · stated "updated regularly", no interval · all expected operators · firm basis stated | range or colour per substation, service · dated 2026-07-04 · refresh not confirmed · all expected operators | no | not confirmed |
| Spain | number (MW/MVA) per substation, service · dated 2026-08-27 · stated monthly · all expected operators · undocumented interface | number (MW/MVA) per substation, service · dated 2026-08-27 · stated monthly · all expected operators · undocumented interface | no | not confirmed |
| Sweden* | range or colour per zone or region, service · dated 2026-05-26 · stated monthly (one edition seen so far) · all expected operators · undocumented interface · firm basis stated | number (MW/MVA) per substation, service · dated 2026-07-02 · refresh not confirmed · one operator (under half the tier) · undocumented interface | no | not confirmed |
| Switzerland | number (MW/MVA) per substation, PDF · dated 2026-06-01 · refresh not confirmed · all expected operators · firm basis stated | not confirmed (about 44 owners identified, not individually checked) | no | not confirmed |
| United Kingdom* | number (MW/MVA) per substation, service · dated 2026-06-26 · refresh not confirmed · Northern Ireland only (1 of 6 expected entities) · undocumented interface · net of queue | number (MW/MVA) per substation, service · dated 2026-07-27 (one operator) · refresh not confirmed · 3 of 15 expected operators · firm basis stated | no | not confirmed |
Available capacity later, in detail
| Country | Grid | What you can see | When | Detail |
|---|---|---|---|---|
| Austria | local | planned upgrades with added MW and target year, written beside today's figure (one operator, Lower Austria) | 2026 to 2032 | per substation, as text |
| Croatia | local | a second range for after a substation's transformers are upgraded | no date (a hypothetical upgrade) | per substation, band |
| Czechia | national | suitable, conditionally suitable or not suitable for new solar or wind | 2031 and 2036 | per substation, band |
| Denmark | national | a second MW figure for the grid after approved upgrades | no year given | per substation |
| Finland | national | MW per station per year; about a third rise as planned upgrades are completed | 2026 to 2035 | per substation |
| France | national | MW still reserved under the regional renewables connection plans, beside today's figure, with the grid works that free it named | scheme period, no dates | per substation |
| France | local | the same reserved MW, with the local grid works named at a few substations | scheme period, no dates | per substation |
| Germany | national | a range with the earliest year you can connect; includes planned substations (1 of 4 operators) | 2032 or 2035 | per substation, band |
| Hungary | local | capacity offered in a wind tender, including planned substations with opening dates | 2030 Q3 | per substation |
| Ireland | local | MW per year in two scenarios | every year to 2040, then 2045 and 2050 | per substation (high and medium voltage) |
| Luxembourg | national | MW for 2030 and 2035; a 380 kV level appears | 2030, 2035 | one value for the whole system |
| Luxembourg | local | MW for 2030 and 2035; new substations appear | 2030, 2035 | per substation |
| Netherlands | national | my calculation: the grid's maximum and the capacity already promised, per year; in most zones the gap closes, in two it widens | every year to 2036 | per zone |
| Netherlands | local | the year congestion is expected to clear (115 of 604 areas) | 2027 to 2036 | per area, a year not MW |
| Poland | national | a 2031 figure beside 2026; the operator's "realistic" figure is 0 MW at every node in both years | 2031 | per substation |
| Poland | local | MW per year (one of five operators) | every year to 2031 | per group of substations |
| Romania | national | MW per zone for 2030 | 2030 | per zone |
| Spain | national | capacity held back at 394 nodes for future tenders (24 of them Just Transition nodes) | tender dates not given | per substation |
| Sweden | local | years until a connection is possible (one operator) | for example 3 to 5 years | per substation, band |
| Switzerland | national | a figure per year on the grid as planned (unit not printed; I read it as MVA) | 2030, 2035, 2040 | per substation |
How I counted
I looked for one thing: a published figure for how much new generation can connect, on each of the two grids. The national grid is the high-voltage network run by the transmission system operator. The local grids are run by the distribution system operators.
- Queued, contracted, connected and installed megawatts are other quantities. They are useful, but they are not available capacity. I note them where they sit next to an available-capacity figure; I do not count them.
- Where an operator publishes today's grid and a planned future grid, both are useful, and both are shown. "Available capacity today" counts today; "Available capacity later" counts what is planned.
- Figures for consumption only (Iceland, part of Norway) are printed but not counted. They answer a different question.
- "Not confirmed" means I did not finish, or could not settle what a figure means. It is not a verdict.
Two cases made me change my own rule, and I would rather say so. My rule was never to calculate an available-capacity figure myself. The Netherlands does not publish one. It publishes, per area, the grid's maximum and the capacity already committed to existing contracts, in the same file, on the same basis, so they can be compared. The difference is exactly what a developer wants to know, and often it is negative. That is the congestion the Netherlands is known for. So I print it, labelled "my calculation". Bulgaria publishes the capacity still available for any new connection, generation and consumption together. The operator's page defines generation-only rows, but none of the responses I archived fills them (I fetched 2 of 474 substations). It is still a useful first filter, so it is in, labelled "generation and consumption combined". Neither counts toward the three.
The evidence: 31 country sheets from live checks of the sources run 7 to 15 September 2026, with every response saved. On 23 September I traced every claim in this piece back to those saved responses.
Timeline sources: permit deadlines from the EU Renewable Energy Directive as amended in 2023 (RED III); permitting in practice from SolarPower Europe, EU Renewable Energy Permitting: State of Play (July 2025); build time from developer guidance for utility-scale solar.
Findings piece, 2026 edition, v1 (2026-09-29) · built on the September 2026 grid update (v1.2) of the European siting-data index · counts of what I found are minimums · corrections welcome.